
 英语
英语 西班牙语
西班牙语 德语
德语Disposable Sample Cups
product manual
Used for cold curing.
We use first- and third-party cookies including other tracking technologies from third party publishers to give you the full functionality of our website, to customize your user experience, perform analytics and deliver personalized advertising on our websites, apps and newsletters across internet and via social media platforms. For that purpose, we collect information about user, browsing patterns and device.
By clicking "Accept All Cookies", you accept this, and agree that we share this information with third parties, such as our advertising partners. If you prefer, you can choose to continue with "Only Required Cookies". But keep in mind that blocking some types of cookies may impact how we can deliver tailored content that you might like.
For more information and to customize your options, click on "Cookie settings". If you want to learn more about cookies and why we use them, visit our Cookie Policy page at any time. Cookie Policy

Metallographic evaluation sits at the intersection of materials science and manufacturing quality assurance. For components destined for surgical instruments, implantable devices, or high-tolerance industrial assemblies, the microstructure of a metal often tells a more reliable story than surface inspection alone. Grain boundaries, phase distribution, and embedded particulates reveal whether a part was processed correctly and whether it carries hidden contamination risks that could compromise performance in the field.
Facilities that rely on optical analysis as part of their inspection routine are able to correlate microstructural findings with functional risk, rather than treating metallography as a purely academic exercise. This is especially true in regulated environments where documentation, repeatability, and traceability of every preparation step matter as much as the final image captured under magnification.
The challenge many labs face is not a lack of technical knowledge, but inconsistency in how specimens are prepared before analysis even begins. A scratched, smeared, or improperly etched surface can mask the very contamination a lab is trying to detect, which is why standardized preparation practice has become a non-negotiable part of any serious metallography program.
A structured guide for preparing metallographic specimens exists precisely because inconsistent technique introduces variability that has nothing to do with the material itself. Sectioning heat, mounting pressure, grinding sequence, and polishing media all leave their own signature on a surface if not controlled carefully. When a lab follows a recognized preparation guide, the resulting image reflects the true microstructure rather than artifacts introduced during handling.
This matters even more for facilities running a shared laboratory system across multiple projects, where different technicians may prepare specimens on different days for different clients. Without a common reference procedure, results become difficult to compare over time, and contamination findings can be challenged simply because the preparation method itself was inconsistent.
| Preparation Concern | Risk if Uncontrolled | Standardization Benefit |
|---|---|---|
| Sectioning heat | Localized microstructural alteration | Preserves native grain structure |
| Mounting pressure and temperature | Edge rounding, retention loss | Consistent edge and inclusion retention |
| Grinding sequence | Deep scratches masking features | Progressive, repeatable surface refinement |
| Etching duration | Over-etch or under-etch artifacts | Reliable contrast for phase identification |
The preparation sequence described in a metallographic specimen guide typically follows a defined order, with each stage building on the surface quality achieved in the previous one. Skipping or rushing any stage tends to surface later as unexplained artifacts under magnification, which can be mistaken for genuine contamination if the technician is not careful.
Each stage above is designed to remove the disturbance introduced by the previous one. Grinding removes sectioning damage, polishing removes grinding scratches, and etching selectively attacks grain boundaries or phases to make microstructural features visible without introducing new distortion.
Once a specimen surface has been properly prepared, the analytical stage begins. Modern labs increasingly rely on digital image capture paired with software-assisted measurement rather than purely visual judgment, since manual estimation of grain size or inclusion density introduces reviewer-to-reviewer variability. Quantitative image analysis allows a lab to report measurable values such as inclusion area fraction, particle count per unit area, and average feature size, all of which support objective comparison across batches.
Inclusion rating in particular benefits from this approach. Rather than relying on a single field of view, systematic scanning across multiple fields produces a statistically defensible picture of contamination distribution. This is especially important for medical device components, where a single overlooked field could mean the difference between passing and failing a lot.
Representative sampling typically spans 8 to 12 fields per specimen to reduce sampling bias.
Reported as particles per square millimeter, allowing lot-to-lot comparison over time.
Consistent grain size distribution correlates strongly with predictable mechanical behavior.
Objective, image-based measurement turns inclusion rating from a subjective visual call into a repeatable, defensible data point that regulatory reviewers can trust.
Facilities that pair this analytical rigor with reliable optical inspection routines tend to catch contamination trends earlier, since digital records make it easier to compare current results against historical baselines rather than relying on memory or scattered paper records.
Contamination analysis for medical device components places additional demands on the laboratory environment itself, not just the specimen preparation steps. A lab evaluating microstructural contamination needs confidence that the particles observed originated in the manufacturing process, not from the lab environment or handling procedure.
These environmental controls work alongside the specimen preparation guide rather than replacing it. A perfectly prepared specimen examined in an uncontrolled environment can still pick up contamination that has nothing to do with the original component, undermining the credibility of the entire evaluation.
Microstructural contamination in medical device materials generally falls into a few recognizable categories: non-metallic inclusions carried over from raw material processing, embedded abrasive residue from machining or polishing, and foreign particulates introduced during handling or assembly. Each of these can appear similar under low magnification, which is why careful preparation and systematic imaging are essential to correctly identify the source.
Non-metallic inclusions often trace back to the original melt or casting process and tend to appear as discrete, angular or rounded features distributed somewhat randomly through the matrix. Abrasive residue, by contrast, is frequently found concentrated near surfaces or embedded along grinding directions, hinting at a process-related rather than material-related origin. Recognizing these distinctions allows a lab to direct corrective action to the right stage of manufacturing rather than treating every contamination finding the same way.

Distinguishing between these contamination sources becomes more reliable when a lab has a consistent baseline to compare against. Tracking inclusion type and location over multiple production lots, rather than evaluating each sample in isolation, often reveals patterns that point directly to a specific upstream process rather than a random, one-off event.
| Contamination Type | Typical Location | Likely Source |
|---|---|---|
| Non-metallic inclusions | Distributed through matrix | Raw material or melt process |
| Abrasive residue | Near surface, along grind lines | Machining or polishing step |
| Foreign particulates | Surface or edge regions | Handling or assembly environment |
Bringing all of the above together into a working program requires more than individual technical skill. It requires a documented, repeatable system that any qualified technician can follow and that any auditor can verify against a written procedure.
A program built on these principles produces results that hold up not only to internal quality review but also to external regulatory scrutiny, since every step from specimen cut to final report can be traced and justified.
Because a poorly prepared surface can introduce or mask features that have nothing to do with the actual material condition, making even the most advanced analysis unreliable.
Most labs sample 8 to 12 fields per specimen to reduce the risk that a single unrepresentative field skews the overall assessment.
In many cases yes, since contamination type and location often correlate with a particular process stage, such as melting, machining, or assembly handling.
Without environmental control, particulates introduced during handling or preparation can be mistaken for genuine manufacturing contamination, undermining the accuracy of results.
Quantitative analysis produces measurable, repeatable data that supports objective comparison across batches and reduces variability between different reviewers.
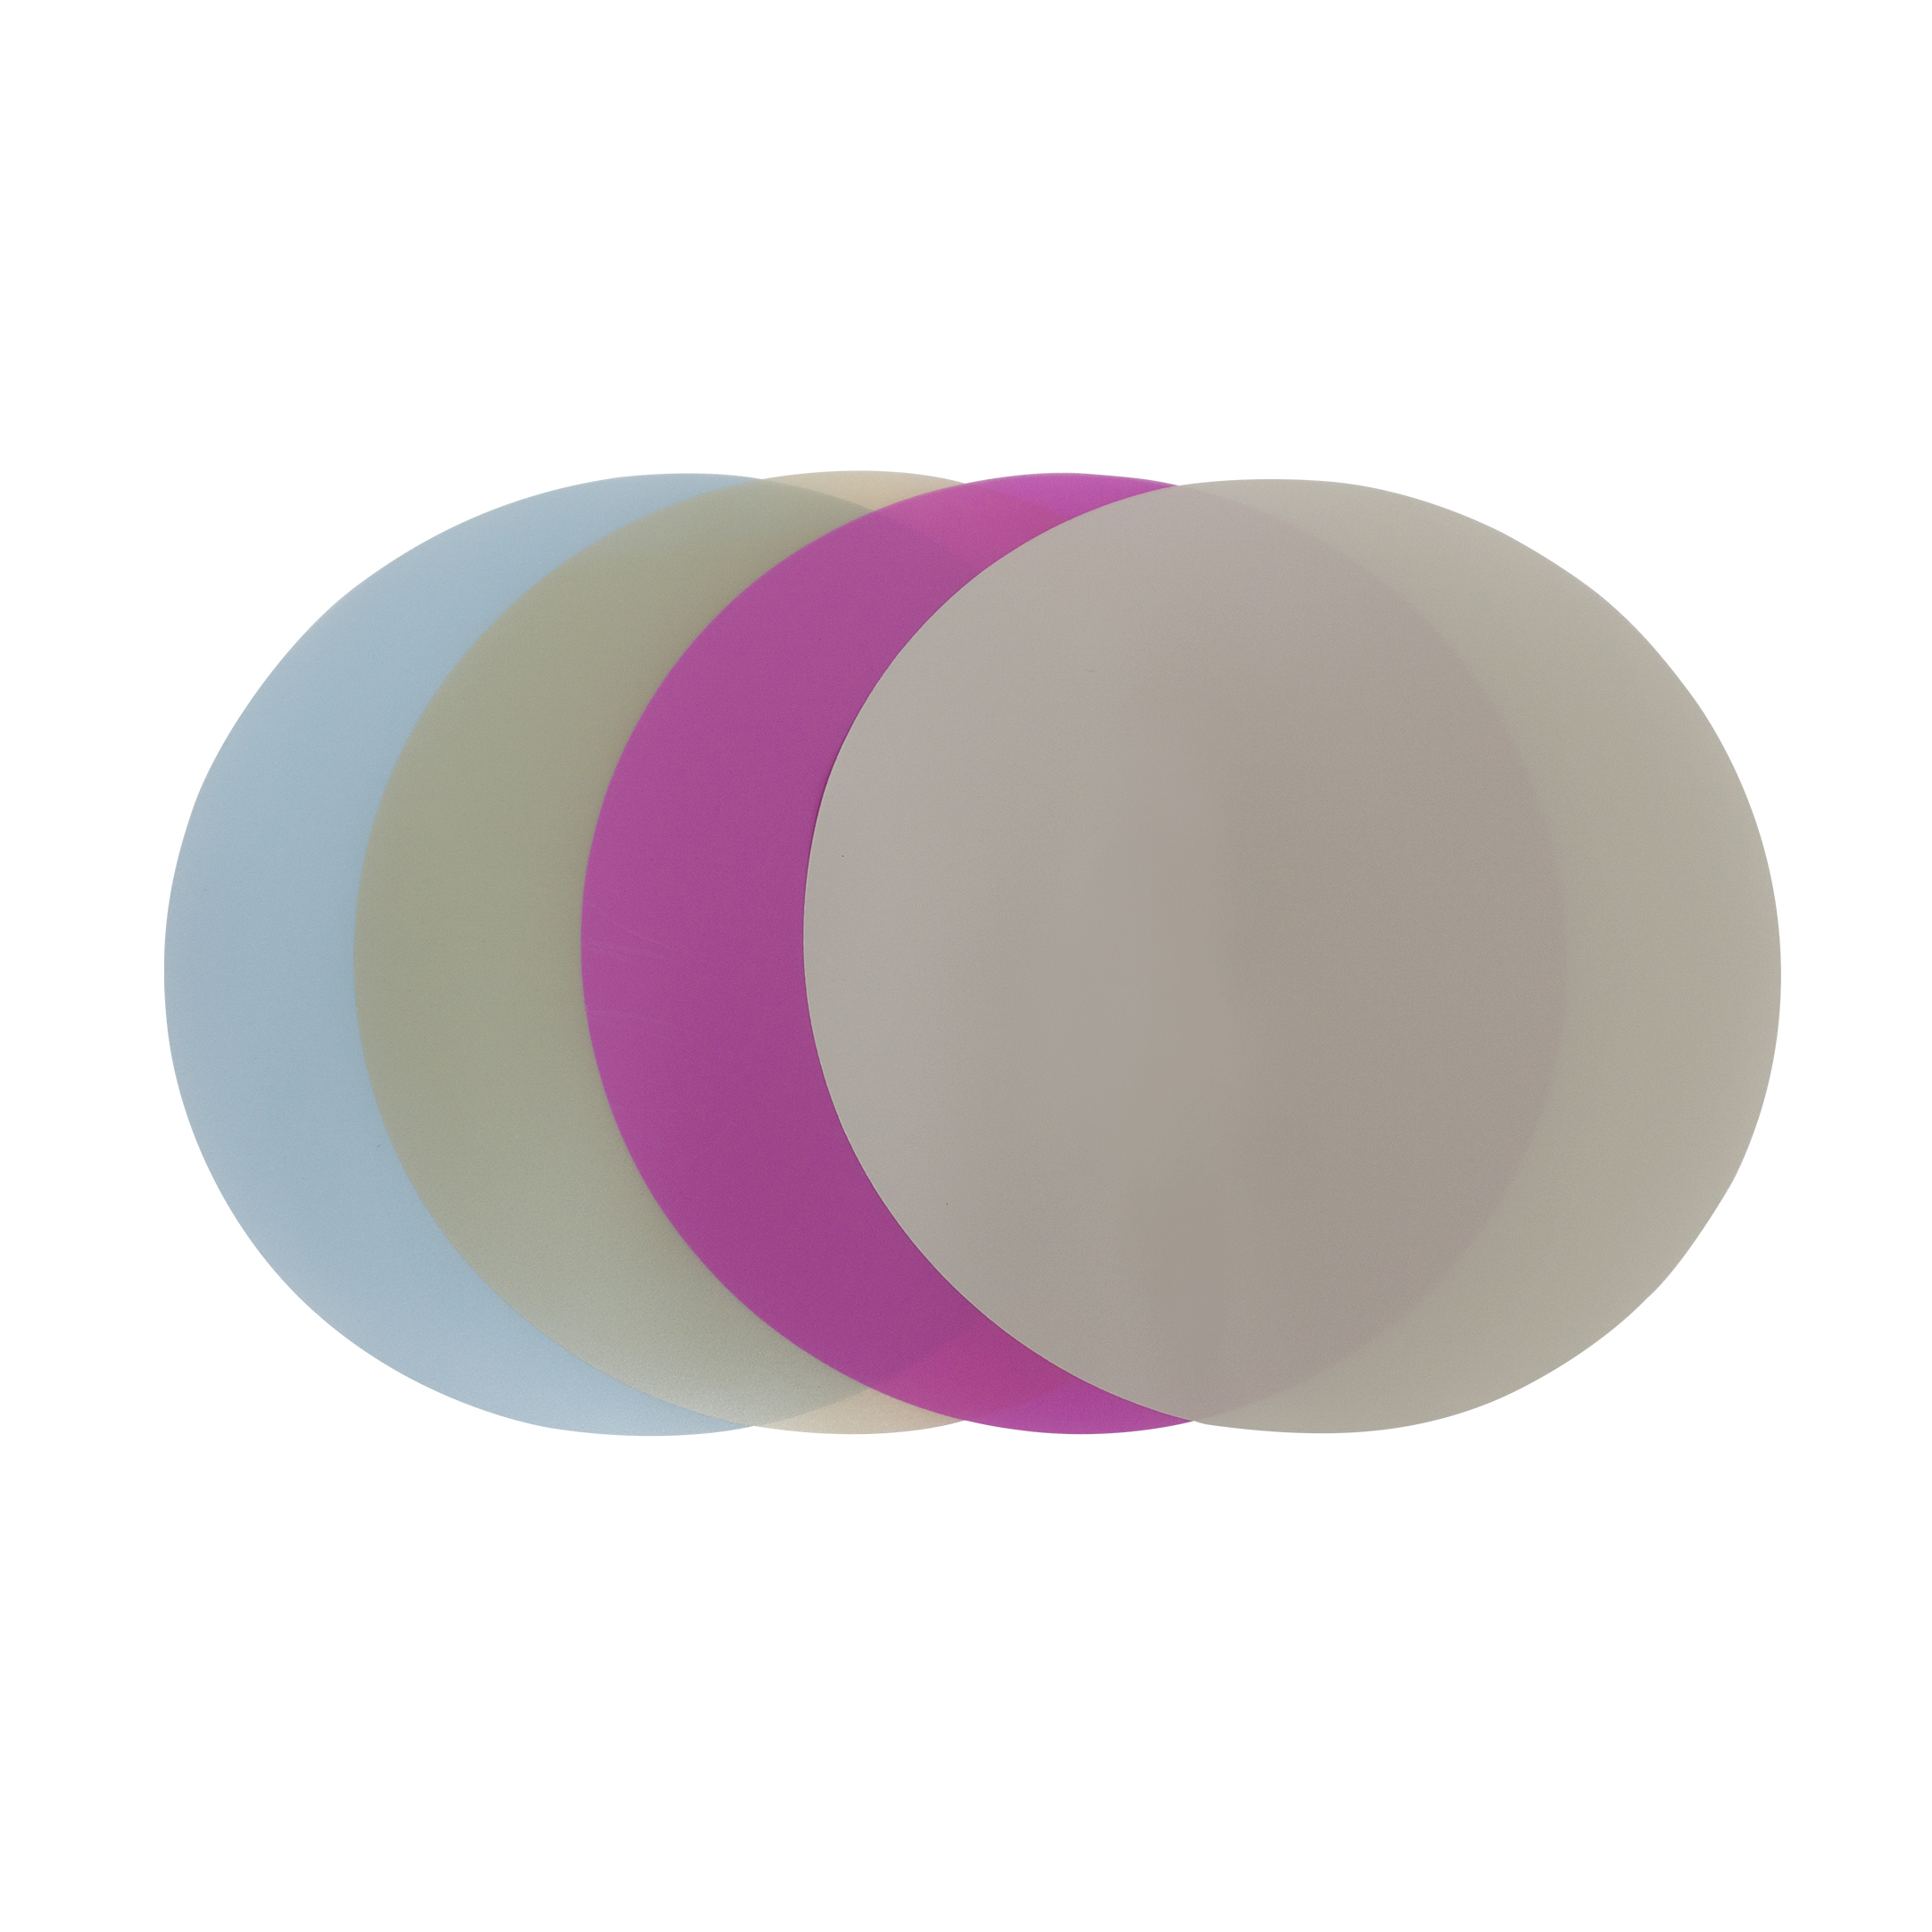
.png?imageView2/2/w/400/format/jpg/q/75 "Disposable Sample Cups")
.jpg?imageView2/2/w/400/format/jpg/q/75 "PL-W Polishing Lubricants")
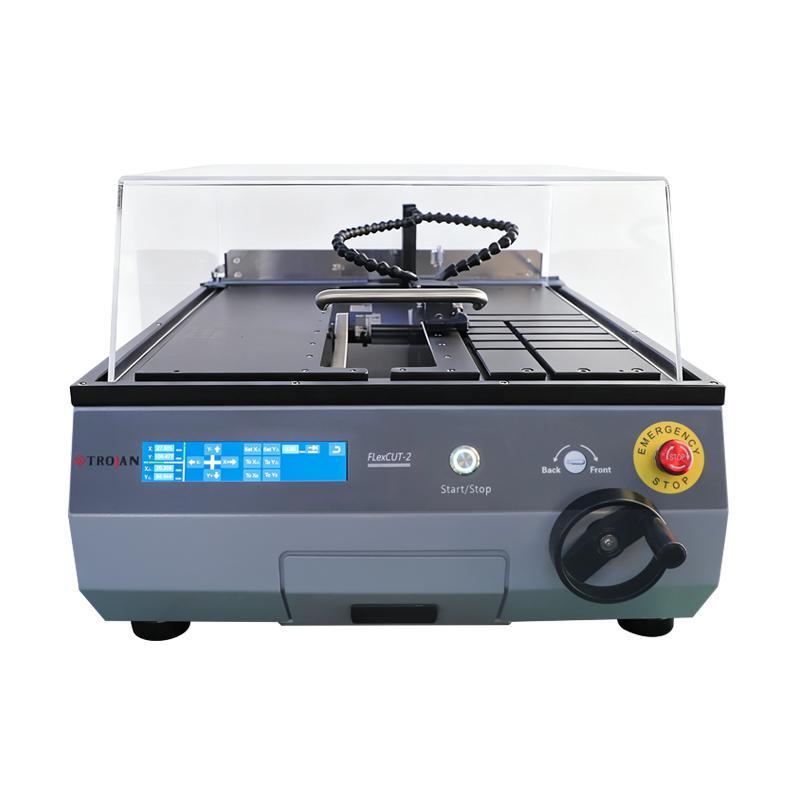

Based in China, TROJAN pays attention to the international market, and has sold metallographic equipment to more than 50 countries, such as Europe, America, Japan and South Korea, Southeast Asia countries and regions


